Current news for the Hancock and Sand Ponds Association Go to our website for general information, maps, news letter, archived documents, environmental information and calendar events.
Sunday, December 6, 2015
Wednesday, October 14, 2015
Wednesday, September 23, 2015

Monday, September 14, 2015
Milfoil Monitoring , Jessie Dubin
This is Jessie's report to Chris that I thought might be of special interest to many of you.
From: H. J. Dubin <hjd72@live.com>
Date: Thu, Sep 3, 2015 at 8:31 PM
Subject: Invasive aquatic plant survey-Sand & Hancock ponds
Hi Chris—
On 2 Sept I surveyed the Denmark/Wabunaki boat landing. I walked the shallow water observing the plants and snorkled the deeper water on left from Genest Camp to the right, almost to Whitney Camp. I walked and snorkeled more or less 100 ft straight out from the boat ramp to a depth of about 5ft. The water is fairly low and this made the survey easier.
I did not observe any milfoil or other known invasive water plants. I did observe more than 10 native water weeds. It took 3 hrs including travel and preparation.
Between 12-16 Aug I surveyed the shoreline by the Blazing Trails camp to Hancock Pond and the Dugway as well as the south side of Sand Pond by Waisanen, Wile, Wise and Neily camps. 3hrs
18 -28 Aug checked Dugway and Biologic Cove again. 1.5 hrs.
This is a total of 7hrs.
I am copying this to Jerry Holt and Joan Ladd since part of the survey is on Hancock.
Sunday, September 13, 2015
Draft 2015 Annual Meeting Minutes
Click here Draft 2015 Annual Meeting Minutes
For past annual meeting minutes and other archived documents go to our website at https://sites.google.com/site/hancocksandpondsassociation/
Friday, July 10, 2015
Warden and Park Service Contacts
Parks and Public lands
Gary Best, Assistant Regional Manager for The Maine Department of Agriculture, Conservation and Forestry, Division of Public Parks and Public Lands.
Phone 207 725-6351
Fax 207 624-6081
email gary.best@maine.gov
See our Blog post regarding our meeting at the state beach July 2014. http://hspanews.blogspot.com/2014/07/state-beach-supervision_32.html
Maine Inland Fisheries and Wildlife
To reach a Game Warden 24-hours a day, please contact the dispatch center nearest you.
Gray
1-800-228-0857
1-800-228-0857
We do have a local warden residing in Denmark but the above number is the preferred contact number for the quickest service.
Friday, July 3, 2015
Annual Meeting 2015
The annual meeting will be held at the Denmark Town Hall on Saturday July 11, 2015. Sign-in begins at 8:30, the meeting will start promptly at 9 am.
Agenda:
LEA presentation
Secretary’s Report
Treasurer’s Report
Committee reports
Committee Operating Guidance
Officer tenure/replacement
Election of Officers
Other new business
There are several volunteer assignments to be filled. Please consider doing more to help the organization and protect the lakes by filling a position or joining a committee. Nominations can be made at the meeting or please feel free to respond and the nomination will be presented at the meeting.
Vice President
Milfoil Coordinator
Buoy placement/removal volunteer(s)
Dam manager(s)
Requirements for the positions are available upon request.
Tuesday, June 23, 2015
Water Level Study Information Session
An information session will be held at the Sebago Town Hall, Potter Academy building on July 1 at 7pm.
This is an informational session only, further discussion and voting will occur at the annual meeting - Denmark Town Hall July 11, 9 am.
The water level committee was formed at the 2014 annual meeting. This committee was charged with researching recent as well as historical data and proposing a water level that would best support the health of both Sand and Hancock Ponds.
Get report HERE
or copy and paste this address into a browser.
https://drive.google.com/file/d/0B4_qn55RcR-uN3JXTkxYeHNvczVoODAxMWsySjNUaUloTTZR/view
Wednesday, May 27, 2015
2014 Annual Meeting Minutes
Here is a Link to the 2014 Annual Meeting Minutes https://drive.google.com/file/d/0B4_qn55RcR-uUlB1QUZOVHI3U3M/view?usp=sharing
For prior years go to https://drive.google.com/folderview?id=0B4_qn55RcR-ucXU0djZRR1RnbGs&usp=sharing
For prior years go to https://drive.google.com/folderview?id=0B4_qn55RcR-ucXU0djZRR1RnbGs&usp=sharing
Sunday, May 24, 2015
Buoys Are In
Thanks to Andrew Clements and Crew for getting in the buoys in spite of the windy weather.


Friday, May 22, 2015
USGS Water Watch

WaterWatch (http://waterwatch.usgs.gov) is a U.S. Geological Survey (USGS) World Wide Web site that displays maps, graphs, and tables describing real-time, recent, and past streamflow conditions for the United States. The real-time information generally is updated on an hourly basis. WaterWatch provides streamgage-based maps that show the location of more than 3,000 long-term (30 years or more) USGS streamgages; use colors to represent streamflow conditions compared to historical streamflow; feature a point-and-click interface allowing users to retrieve graphs of stream stage (water elevation) and flow; and highlight locations where extreme hydrologic events, such as floods and droughts, are occurring.
The streamgage-based maps show streamflow conditions for real-time, average daily, and 7-day average streamflow. The real-time streamflow maps highlight flood and high flow conditions. The 7-day average streamflow maps highlight below-normal and drought conditions.
WaterWatch also provides hydrologic unit code (HUC) maps. HUC-based maps are derived from the streamgage-based maps and illustrate streamflow conditions in hydrologic regions. These maps show average streamflow conditions for 1-, 7-, 14-, and 28-day periods, and for monthly average streamflow; highlight regions of low flow or hydrologic drought; and provide historical runoff and streamflow conditions beginning in 1901.
WaterWatch summarizes streamflow conditions in a region (state or hydrologic unit) in terms of the long-term typical condition at streamgages in the region. Summary tables are provided along with time-series plots that depict variations through time. WaterWatch also includes tables of current streamflow information and locations of flooding.
Wednesday, May 20, 2015
Lower Spring Water Level Not Refelective of Policy Change
The plan for this Spring was to maintain past water levels. The transition from the previous dam manager to an interim manager left a void. I was not able to get to the dam myself in a timely fashion. Dry weather has not helped.
The dam gate was not "closed" soon enough to support past Spring water levels. "Closed" means the gate must be left open at least a few inches for downstream flow.
Current conditions are not related to the Water Level Committee. Any recommendations from the committee are future oriented and must be approved by members at the annual meeting.
Jerry Holt
HSPAMaine@gmail.com
USGS Water Watch Click here for info regarding water flows and drought conditions.
USGS Water Watch Click here for info regarding water flows and drought conditions.
Monday, May 18, 2015
Dry Winter and Spring
In spite of all the snow we had this winter the water content was approximately half of a normal winter. This spring also has been dry with below normal rainfall. "Most areas need 2-6 inches of rain to elevate the current drought conditions."
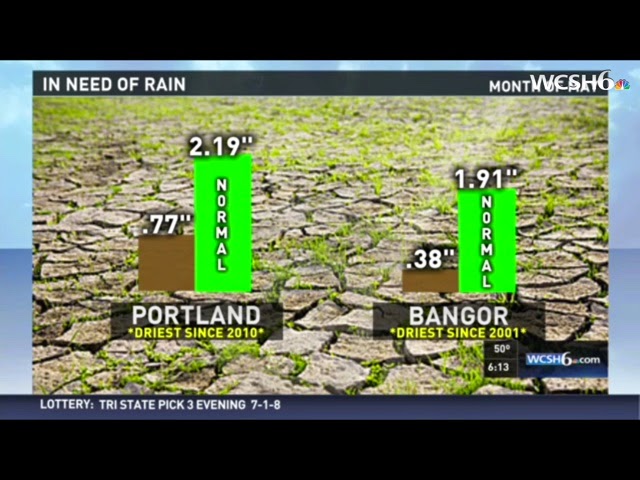
Check out this article from the Portland Press Herald.
The graphic below is from Monday May 18th morning weather report. This only refers to rainfall deficit for the first 18 days of May.
Wednesday, May 13, 2015
Retirements
Retirements
Ed Cooper has retired from managing the dam on Hancock Pond. Ed is one of the "originals' on the pond and has given many years of service to HSPA.
Chris Gouterman is retiring from our milfoil/boat inspection program and has diligently kept us up to date regarding these issues.
Both Ed and Chris have volunteered great time and effort, often behind the scenes, to make Hancock and Sand Ponds a better place to enjoy.
Thank You
Saturday, April 18, 2015


Friday, April 17, 2015


Monday, March 9, 2015
1990 Dam Reconstruction Video

In July 1990 Ed Baumer had the foresight to video tape the dam reconstruction project. He produced a 44 minute VHS tape which came to the attention of Clare Mckeagney. Clare obtained Ed's approval to convert to digital media and successfuly converted the whole tape to DVD. YouTube required one more conversion before being able to view online but could not successfully convert all 44 minutes. This is the first 16 minutes of Ed's original video. We can arrange for additional full length DVDs to be produced, if there is interest from the membership.
Click here for the Dam video.
2015 Newsletter and Temp Graph Insert
Good day.
As usual Joan did a great job putting this together!
The paper version was printed with the newsletter itself in black and white and the temp graph insert in color. Color allows the graph gradients to be more easily read.
Click for Newsletter
Click for Graphs of Daily Water Temperatures
As usual Joan did a great job putting this together!
The paper version was printed with the newsletter itself in black and white and the temp graph insert in color. Color allows the graph gradients to be more easily read.
Click for Newsletter
Click for Graphs of Daily Water Temperatures
Saturday, February 28, 2015
Milfoil Conference 2015 Factoids and Notes
Chris Gouterman is our milfoil coordinator but was unable to attend so I filled in for her..... Jerry Holt
A few notes on what I learned at the conference.
Courtesy Boat Inspection Handbook http://www.maine.gov/dep/water/invasives/cbi-handbook.pdf
Invasive species does not just mean plants and other marine life from "away". Example - a Maine native bass introduced to a primarily brook trout body of water is an invasive species because the bass is more aggressive and has no natural predators in the new body of water.
Maine provides over 90% of the brook trout fishing in the US.
Any plant transfer from a body of water via boats or trailers is illegal regardless of it being an invasive species or not.
LEA coordinates the milfoil training and is the financial conduit for much of the funding state wide.
LEA is pursuing electronic data collecting for boat inspections.
In 2014 there were over 30,000 CBIs (courtesy boat inspections). There were 109 inspections that identified invasive plants (saves).
65 of the 109 saves were from Lake Arrowhead in Limerick!!
Lake Arrowhead has two milfoil harvesting boats running 6 days a week.
A panelist from Lake Arrowhead reported real estate values of waterfront properties on that lake have dropped 32% since 2007, causing Limerick to raise the mill rate for all property owners in town.
Discussion regarding closing access to surface waters of severely infected waters varied from no way to yes. There were many variations of the two extremes which were noted by state officials for further consideration. Two moderate ideas were to close access points (with a gate) when no inspectors are available and direct launching and take out activities to a single access point for better monitoring.
Bass tournaments may or may not be sanctioned by the state. If sanctioned they must have a trained CBI and all boats inspected upon launch and take out. This does not prevent the local CBI from also performing their duties. Sanctioned tournaments will have stickers on the boats indicating such.
Bass tournaments are a highly visible activity and an easy target for blame but may only be part of the problem. Activity that we don't see or is not organized may play a stronger role in spreading milfoil.
I tried to hit the high points with enough description for you to understand the issues discussed but not so much as to bury you in details. I hope I succeeded.
Remember Chris Gouterman is our milfoil coordinator and any general concerns should be directed to her.
Friday, February 27, 2015
Maine Milfoil Conference 2015 Pictures
Panel discussion regarding restricting surface access to infected lakes/ponds.


Commissioner Inland Fisheries and Wildlife presentation on invasive fish.

LEA's Mary Jewit training session on Courtesy Boat Inspections.

Saturday, January 24, 2015
Water Testing - heat maps
The following is from Colin Holme of LEA regarding heat maps of Sand and Hancock ponds.
Hi Hancock and Sand Ponders,
I thought you might be interested in seeing the new temperature data from Hancock and Sand Ponds in another (perhaps more easily digestible) form. These maps (the first two attachments) show temperature variation in the water column over time. The left hand side of the graph shows the depth from the surface, with the top of the graph representing the top of the pond. Lake layering deepens over time (block of color extends further down) until it breaks down. The uniform color on the right side of the graph indicates lake mixing. This type of display gives a very quick synopsis of an entire season’s temperature data and when we have data from a couple years, it will be easy to see big differences that are likely one of the primary drivers responsible for changes in algae growth. This type of detailed data is only possible because of the new sensors that were put in last year. Feel free to pass this on to anyone interested.
I also attached our full temperature and gloeotrichia report (the 3rd and 4th attachments) from 2014 for those of you who did not see them yet. Previously posted in this blog December 2014. Scroll down this page and you will see the other water quality testing reports.
Thanks for all the help in making this possible.
Colin
Colin Holme
Lakes Environmental Association
Subscribe to:
Posts (Atom)